Forex Trading Articles
STOCHASTIC MOMENTUM INDEX
PART III

By Alan Benefield for Forexmentor Team
©2007, Currex Investment Services Inc.
February 5, 2007
In this article, we will cover the last indicator from the Daily 3 Stochastic System, the Stochastic Momentum Index (SMI), which is a smoother version of George Lane’s original Stochastic oscillator. This indicator was developed by William Blau and was first introduced in the magazine ‘Technical Analysis of Stocks & Commodities’ in January 1993.
The formula for Stochastic Momentum Index makes for a much smoother oscillator or less erratic then the same period Stochastic oscillator. In order to smooth out George Lane’s Stochastic oscillator, most people would stretch the period say from 5, 3, 3 to 10, 3, 3. So the Stochastic Momentum Index is a naturally smoother indicator at a quicker setting then the Stochastic oscillator.
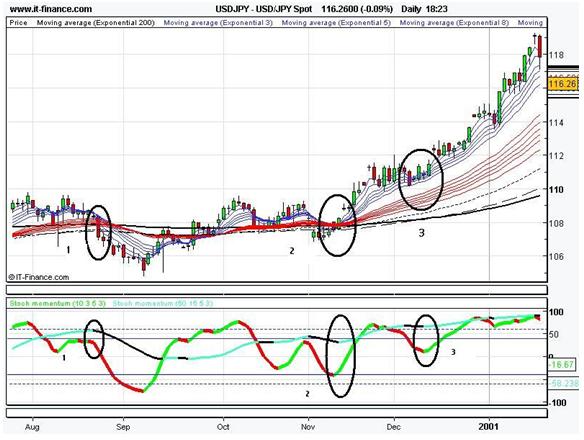
Illustration I
The Green/Red SMI is the 10, 3, 5, 3 for the daily chart. The Black/Baby Blue SMI is the 50, 15, 5, 3 setting that reflects the weekly chart.
Also note the dotted horizontal lines on the SMI indicator, this is the +60 and the -60, this is the line of death or the extreme overbought or oversold levels! You do not want to enter any trade if the 10, 3, 5, 3 SMI is at that level, due to risk of price reversal.
Below are the SMI settings used in this system. Please note that this indicator is hard to find and you will have to see if it’s available on your charts. It’s available on the IT Finance charts.
Stochastic Momentum Index (SMI) 10, 3, 5, 3
Make SMI 1 color up green and color down red, #3 thickness solid line. Make Signal 1 invisible. Signal method simple and apply to close. Add line at +60 and -60 a dotted line.
Stochastic Momentum Index (SMI) 50, 15, 5, 3
Plot this on the same window as the 10, 3, 5, 3 above. Make SMI color up green blue and color down black, #2 thickness solid line. Make Signal #2 invisible. Signal method simple and apply to close.
Trading Signals

Illustration 2
1. Sell signal when the weekly SMI goes black and the daily SMI goes Red and is not at or below the - 60 extreme over sold dotted line. Price action is not going to run into red GMMAs, or the 89, 144, or 200 EMAs. Here we enter when a candle closes below all the EMAs. Exit or profit taking on this trade would be when the daily SMI turns green.
2. Buy signal when the weekly SMI goes baby blue and the daily SMI goes green and is not at or above the +60 extreme over bought dotted line. Price action is not going to run into walls also known as red GMMAs or the 89, 144, or 200 EMAs. Exit or profit taking on this trade would be when the daily SMI turns red.
3. Again, another buy signal that is the same as above. In this case the weekly SMI is above the +60 line. However the daily SMI is below and moving up so it’s a good buy signal with a tighter stop.
Using the IT Finance Charts, you can plot a mini version of the weekly SMI chart on top of the daily chart instead of plotting the 50, 15, 5, 3 in the same window. This gives a smoother weekly SMI signal to work with.
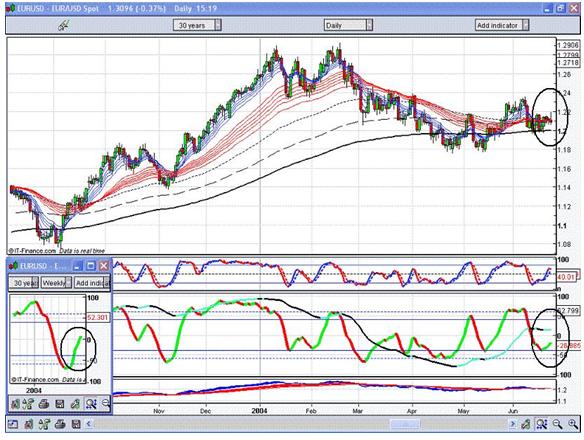
Illustration 3
Here is another chart with the weekly chart SMI fitted on the daily chart. This is the same signal line as the black/baby blue line on the daily chart, but it’s more of a distinct signal in the little window. I like to have both up to get the best weekly sentiment on the overall trend before our EMAs tell us.
This is a buy because SMI daily is green and the SMI weekly is green or baby blue. Price action is moving away from all EMAs.
In the next article, I will show you how to set up your charts and to apply two more optional confirming indicators.
Alan Benefield
Proceed to the next section
Index of All Forex Trading Articles
"I feel totally empowered and humble all at the same time. If everyone learned from you guys, it might get a lot more difficult to make money in the Forex. Last week, using Chris's basic guidance I captured 300+ pips"
- Darryl Warren - Lompoc, CA

FOREXMENTOR PRO TRADER ADVANCED FX COURSE
Full Content Summary
|
|