Forex Trading Articles
DAILY 3 STOCHASTIC SYSTEM SETUP
PART IV

By Alan Benefield for Forexmentor Team
©2007, Currex Investment Services Inc.
February 6, 2007
I use two monitors and the chart below is a set up I use for all 20 currency pairs. I have 5 lots called “Daily Guppy Master 1 – 5”. These are saved so I only need to click on them to pull each lot up. You can visit IT Finance site at http://www.cbfx.com/charts/chartsdemo.htm and download their chart manual to learn how to save templates or lots.
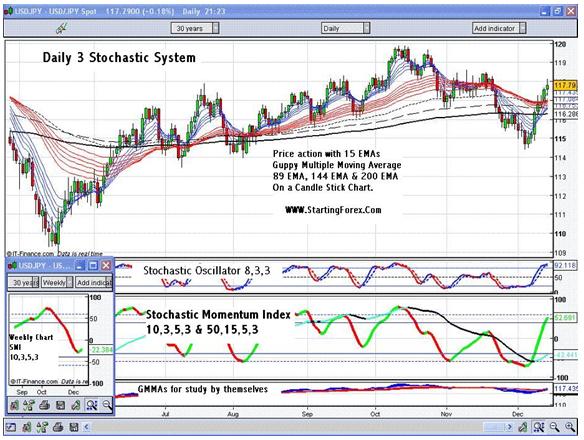
Illustration I
It takes many hours to set up these charts, but you will save yourself time later when you are trading.
RUNDOWN OF THE DAILY CHARTS
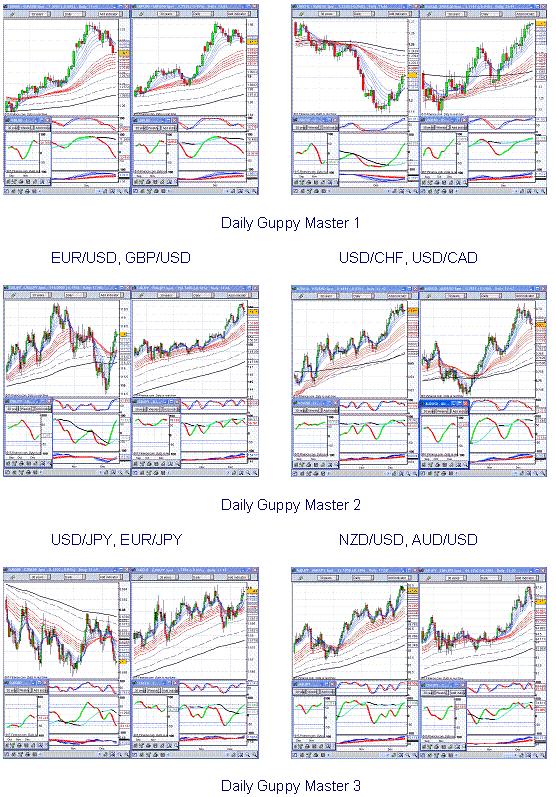
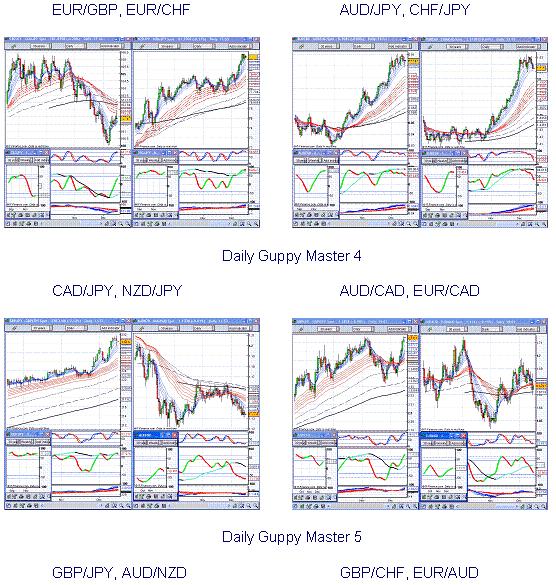
Illustration 2
Also I have what I call master charts for each of the 20 currency pairs. On these I have the 4 hour, daily, and weekly charts. I also plot the optional confirming indicators RSI and MACD with Stochastic oscillator, Stochastic Momentum Index and the GMMA window.
In case you ever want to try day trading, I suggest setting up the 5 minute, 15 minute and 1 hour charts.
THIS IS WHAT MY MASTER CHARTS LOOK LIKE
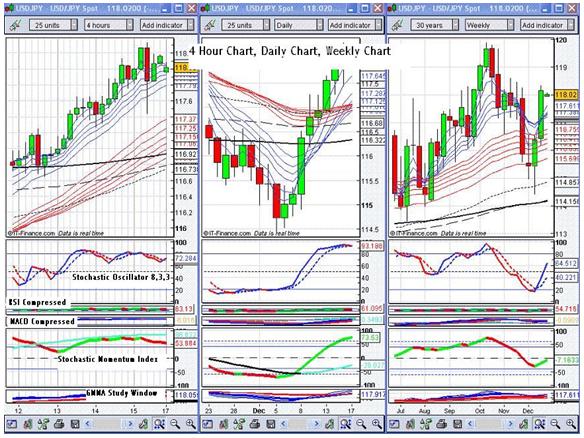
Illustration 3
Here I plot 3 charts on one screen, the 4 hour chart, daily chart and weekly chart. You can also see all 5 indicators plotted with the two optional confirming indicators compressed down.
Stochastic Oscillator (STO)
Relative Strength Index (RSI) {compressed down}
Moving Average Convergence Divergence (MACD) {compressed down}
Stochastic Momentum Index (SMI)
Guppy Multiple Moving Average (GMMA) {compressed down}
Optional confirming indicators that I use on the master charts are listed below. I have found that you may also confirm the buys and sells by using the Relative Strength Index (RSI) and MACD Moving Average Convergence/Divergence.
Relative Strength Index (RSI) I only use this indicator for signal confirmation to buy or sell. RSI 14 set to green going up and red going down, make line very thick so it’s easy to see. Horizontal line at 50 mark dotted line.
Signal Confirmation : RSI above 50% green is a good buy and RSI below 50% line and red is a good sell.
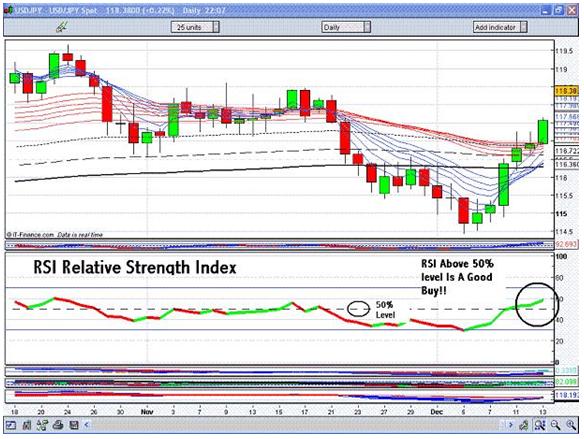
Illustration 4
MACD Moving Average Convergence/Divergence I do not look at MACD to make trades, but I will check it to confirm buy and sell signals. Settings are 12, 26, 9 short term MA 12, Long term MA 26, Signal Nbr periods 9. Make Signal line red solid line #3 and MACD line blue solid thickness # 3. Set MACD histogram to light green going up and orange going down.
Signal Confirmation : When MACD blue is above Signal Line red and showing good angle and separation, then it’s a good buy. When the Signal Line red is above the MACD line blue and showing good angle and separation then it’s a good sell.
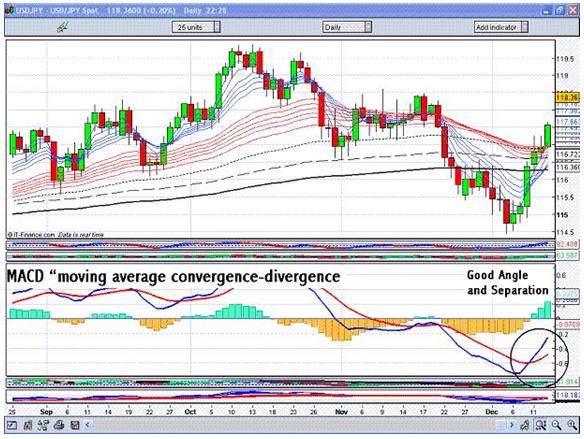
Illustration 5
I plot these on the daily chart to confirm the Stochastic Momentum Index (SMI) buy or sell signals.
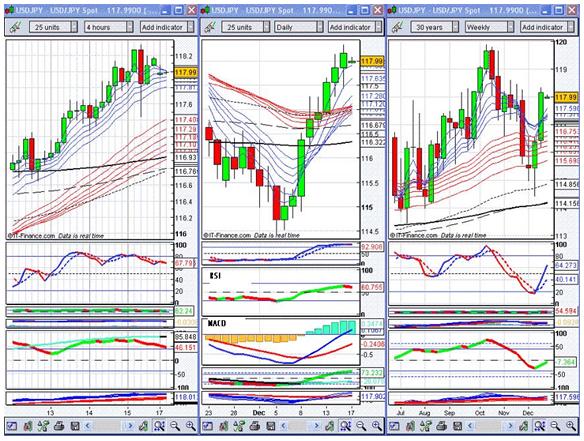
Illustration 6
I plot those other indicators on the master charts compressed down.
In the next article, we will put all this together with some rules and a checklist using a 3-step approach.
Alan Benefield
Proceed to the next section
Index of All Forex Trading Articles
"I feel totally empowered and humble all at the same time. If everyone learned from you guys, it might get a lot more difficult to make money in the Forex. Last week, using Chris's basic guidance I captured 300+ pips"
- Darryl Warren - Lompoc, CA

FOREXMENTOR PRO TRADER ADVANCED FX COURSE
Full Content Summary
|