Forex Trading Articles
STOCHASTIC OSCILLATOR
PART II

By Alan Benefield for Forexmentor Team
©2007, Currex Investment Services Inc.
February 2, 2007
The Stochastic oscillator was developed by Dr. George Lane to help track market momentum. While most indicators use the close of the price action, the Stochastic oscillator tracks the high and low over x number of days. If you use just the close, then you basically have another moving average. By using the extremes of price, you get a leading signal ahead of average based indicators.
Stochastic settings are 8, 3, 3 Nbr periods 8, %K3, %D3. Up movement blue for both lines and down movement red for both lines. Make them thick so it’s easy to see. Horizontal Line at 50 mark dotted line.

Illustration I
Trading Signals
When Stochastic is all the way to the top at 100 level - it’s overbought. Go short when it starts to hook back down heading for oversold 0 level. The opposite is true also, when it’s in the oversold area at or around 0 - then look for it to hook “fish hook” back up heading for overbought.
The shape of a Stochastic bottom gives some indication of the ensuing rally. A narrow bottom that is not very deep indicates that bears are weak and that the following rally should be strong. A broad deep bottom signals that bears are strong and that the rally should be weak.
The same applies to Stochastic tops. Narrow tops indicate that the bulls are weak and that the correction is likely to be severe. High wide tops indicate that bulls are strong and the correction is likely to be weak.
What timeframe to use with Stochastic
The buy and sell signals work best on the higher time frame charts – the daily and 4 hour charts. Here is an example of how Stochastic becomes crazy when the same time is shown on the 4 hour and then 1 hour chart.
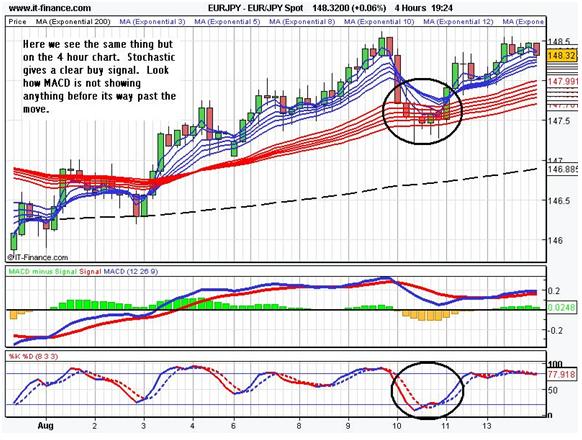
Illustration 2
On this 4 hour chart above, the circled area clearly shows a good signal.
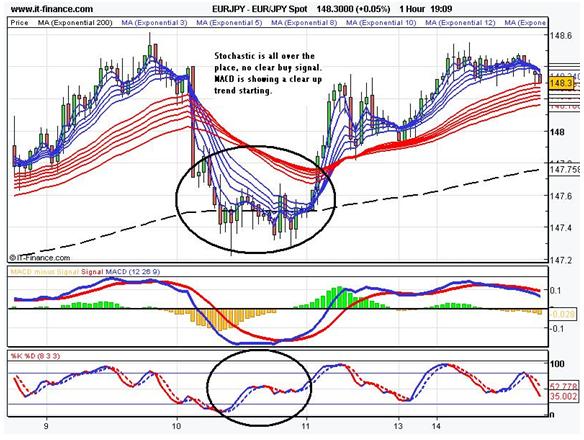
Illustration 3
Now look what happens when we go down to the 1 hour chart. Looks like something broke on the Stochastic oscillator. However, the extra candles make for a good MACD buy signal. It’s a good example of using the Stochastic oscillator 8, 3, 3 to buy the dips in a strong uptrend.
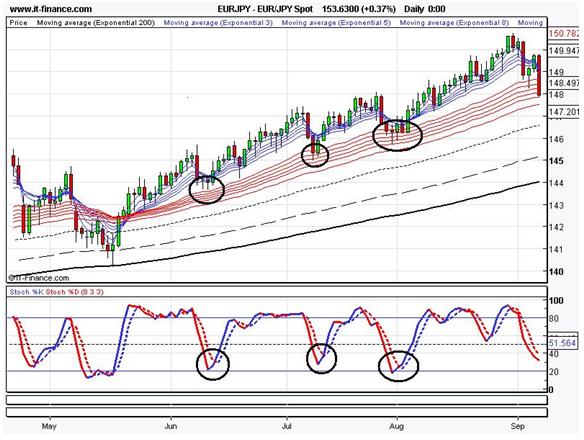
Illustration 4
On the chart above we see that the red GMMAs are showing good angle and separation. We also see that the blue and red GMMAs are riding above the 89, 144 and 200 EMAs - this shows a long term uptrend.
Also note that the 89 EMA is above the 144 EMA, which is above the 200 EMA. This again confirms a long term uptrend and forms walls of resistance to support price action.
We have 3 Stochastic oscillator buy signals shown on the chart above. I call these “Trending Market Stochastic Dip Buy Signals”.
Each black circle in the Stochastic oscillator shows oversold and a good place to hop into this uptrend or “jump in the boat on the river”. Look how the blue GMMAs together with price action dive into the red GMMAs and fail to penetrate past them. If the GMMAs ever get that far, they still have the 89, 144 and the 200 EMAs waiting for them.
Remember, the trend is the flow of the river and we are jumping in at the best time, in order to ride the trend.
Alan Benefield
Proceed to the next section
Index of All Forex Trading Articles
"I feel totally empowered and humble all at the same time. If everyone learned from you guys, it might get a lot more difficult to make money in the Forex. Last week, using Chris's basic guidance I captured 300+ pips"
- Darryl Warren - Lompoc, CA

FOREXMENTOR PRO TRADER ADVANCED FX COURSE
Full Content Summary
|