Forex Trading Articles
"DAILY 3" STOCHASTIC POSITION TRADING
SYSTEM
PART I

By Alan Benefield for Forexmentor Team
©2007, Currex Investment Services Inc.
February 1, 2007
My system is designed to be used by someone who works a day job and can not watch the charts during the main sessions. It does not take months to learn this system and I feel that anyone can learn this in a few hours. We will be spending most of our time looking at the daily and weekly charts. You need to remember 3 key pictures. Two are about fishing, fish and fish net. The third one is a wall or a dam. The thicker the wall, the harder it is to knock down. I know this doesn’t make any sense yet, but it will, as you learn more.
The Daily 3 Stochastic System is a quick visual method of finding good long term trading setups at the first glance of the charts. I use a system of colors on price action as well as other indicators. We will be using 15 EMAs (Exponential Moving Averages) with 5 indicators color-coded on the charts. This sounds like a lot of indicators to worry about, but you will see that I have made this extremely simple to apply them all. We only use 3 when first looking for trading opportunities and then 2 more for confirmation. The two confirming indicators are optional. The system can be used with only the main indicators but I suggest to use them all. All EMAs are used to show resistance or support to price action and overall price trend.
In this first article, we will be looking at the EMAs used in this system.
Exponential Moving Averages: Applied to Close of the price
200 EMA black thick solid line
144 EMA black thin long dash
89 EMA black thin doted line
Guppy EMAs (GMMA): A p plied to Close of the price
6 fast blue Thin Solid EMA lines 3, 5, 8, 10, 12, 15.
6 slow red Thin Solid EMA lines 30, 35, 40, 45, 50 and 60.
I like to plot these in another price window by themselves to expand them over the whole chart.
Daryl Guppy is the inventor of this system using 12 Exponential Moving Averages called Guppy Multiple Moving Averages (GMMA). Six slow EMAs red, with six fast EMAs blue. We can think of the red slow EMAs as the fish or water flow. This system uses EMAs to show strength of the trend as well as resistance to price action. Same applies to the GMMA. More about Daryl Guppy can be found at this link: http://www.guppytraders.com/
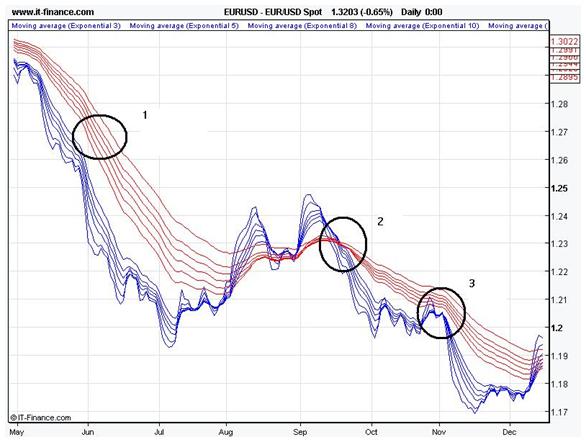
Illustration I
1. Shows the red GMMAs spreading apart with good angle and separation. This shows that it’s a strong trend - fast moving water in this river, or think of it as a group of fish swimming in the same direction.
2. Shows the GMMAs coming together or converging. This shows a weak trend or a new trend starting. When red EMAs are close together, it’s easy for price action to cross over them.
3. Shows the fast blue GMMAs bouncing off the now spreading red slow GMMAs. This would be a good sell signal from just looking at the GMMAs on this chart. This would be confirmed by our Stochastic going overbought.
When the blue EMAs punches in all the way through the red EMAs, it is an early warning that the trend may be ending. Look at how the lines crossed, I call this a fish net.
Now let’s go back and look again at that first chart.
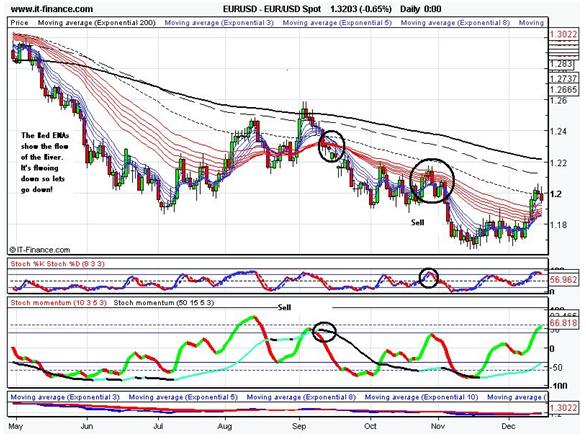
Illustration 2
Notice how Stochastic went to the top - that would be overbought and a good place to enter into this downtrend. The blue EMAs bounced off red EMAs like hitting a wall.
When you see the red EMAs spreading apart, then use Stochastic oscillator 8, 3, 3 to enter in a downtrend.
Now let’s look at the other EMAs used with this system.
200 EMA - the solid black line
144 EMA – the long dash black line
89 EMA – the dotted black line
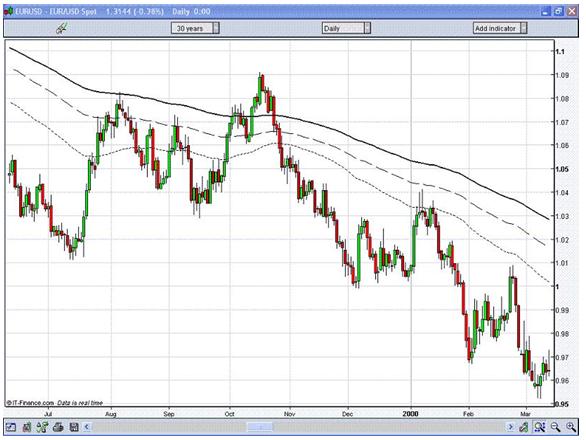
Illustration 3
Look how price action behaves when it hits the EMAs on this chart. On the left side we see a step up action before the 200 EMA finally sends the price back down.
Now we add the GMMAs with the rest of the EMAs to get the next chart.
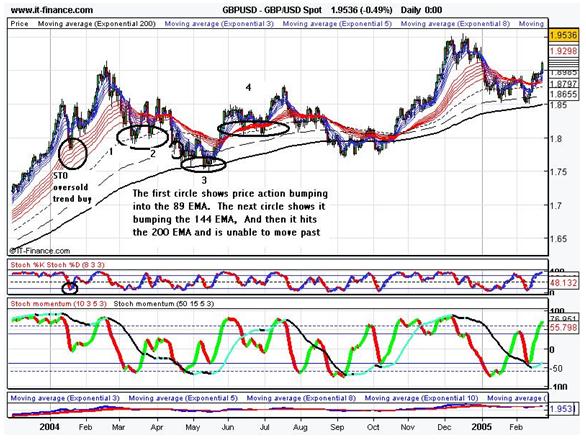
Illustration 4
Above is a quick example of a trend buy using the Stochastic oscillator in a good uptrend, shown at the far left of the chart. We will cover this in more detail in the next article.
1. Shows candles or price action being resistant to the 89 EMA. Look closely and you will see that it hit the 89 EMA three times before it moved down to the 144 EMA.
2. Shows price action hitting the 144 EMA before moving down to the 200 EMA.
3. This shows the 200 EMA ( Great Wall of China) stopping the downward price action attack dead in its tracks!
Think of the 89, 144 and 200 EMAs as walls that must be knocked down, so that price action can move on. When the 89 EMA is above the 200 EMA than this is showing an upward trending price action. With the GMMAs the more separation – spreading apart with good angle and separation you have, the stronger the trend is.
Alan Benefield
Proceed to the next section
Index of All Forex Trading Articles
"I feel totally empowered and humble all at the same time. If everyone learned from you guys, it might get a lot more difficult to make money in the Forex. Last week, using Chris's basic guidance I captured 300+ pips"
- Darryl Warren - Lompoc, CA

FOREXMENTOR PRO TRADER ADVANCED FX COURSE
Full Content Summary
|