Forex Trading Articles
TOP DOWN TRADING
By Dick Thompson for Forexmentor
©2010, Forexmentor.com, November 2010
We students at Forexmentor have been learning about Top Down Analysis from just about each and every member of the Forexmentor team from the AM Review to the Pro Traders Club. It has been emphasized over and over again and is an integral part of trading with support and resistance, which is fundamental to the Forexmentor trading concept.
The reason for the importance of this analysis has always made sense; whatever time frame we trade, it is important to know what is happening at a higher level. We must be able to visualize the forest in order to understand a tree. We may see movements on smaller time frames which are opposite of that big picture, but they will tend to be relatively short termed corrections in the overall movements. For instance, if the big picture is describing a bullish trend and a short term chart is moving down, we can expect the short term movement to reverse and resume in the direction of the long term trend, which gives us a certain edge in planning our trades.
I have always been quite comfortable with this concept because it is fundamental to a method of trading that I once used trading the stock market called the Triple Screen trading system. This is
a methodology that was developed by Dr. Alexander Elder. It was first published in Futures magazine in 1986 and was further described and enhanced in his classic books, “Trading for a Living” (1993) and “Come Into my Trading Room” (2002). Both of these books are well worth the time to read and study at length.
As Dr. Elder states: "The key principle of Triple Screen is to begin your analysis by stepping back from the markets and looking at the big picture for strategic decisions. Use a long-term chart to decide whether you are bullish or bearish, and then return closer to the market to make tactical choices about entries and exits."
The Triple Screen is a system of identifying and trading a trend. The fundamental thesis is to first understand what a stock is doing long term (First Screen) i.e. is there a trend. If there is a trend, you eliminate the option of trading against the trend and are left with only the choices of trading with the trend or standing aside. If there is a potential of a trade, go to an intermediate time frame (Second Screen) to understand how price is moving within that trend and look for opportunities to trade. Look to buy the dips in an uptrend or sell the rallies in a downtrend. Sound familiar? If an opportunity is found, go to an even shorter time frame (Third Screen) and fine-tune an entry based on your favorite entry method. Upon completion of a Triple Screen scan, you will not be given a firm buy or sell signal, but with the proper analysis, will know whether to go long, short or stand aside.
It is important to note in this discussion that long term, intermediate term and short term are
all relative. Long term does not automatically mean daily or weekly or monthly, although it might. The way it works is that we as traders, select our favorite time frame; the time frame that we are most comfortable trading. We call this timeframe intermediate and we select a long term and short term by moving to a higher or lower timeframe.
Dr. Elder analyzes his three time frames with a very few indicators; trend following indicators
for the long term screen to aid in identifying the trend, oscillators for the intermediate term to help know when a pullback is in place. He stresses keeping the number of indicators to a minimum and prefers no more than five. Some of these are of his own creation.
We begin the Triple Screen by identifying the type of trader we are. Do we prefer long term position trading? Swing trading? Day trading or scalping? Based on our style, we select our favorite time frame to trade. For instance as a position trader, we might chose to trade the daily chart; as a swing trader, the 4 hour or the 1 hour chart; as a day trader, we might like the 15 minute chart. Once that decision is made, that preferred chart is identified as our intermediate time frame and becomes our Second Screen. As suggested by Dr. Elder, we then separate the timeframes by as close to a factor of five as our trading platforms allow, and choose a higher and a lower time frame. For example, if we are position traders using the daily chart, that would be 1 day X 5 = 5 days. This would define the weekly chart and this becomes our First Screen. Similarly, we select the Third Screen by dividing the intermediate time frame by five: 1 day / 5 = 4.8 hours, or the 4 hour chart. Some trading platforms have the ability to refine these choices of time and will allow more precise timeframes, if you choose to do that.
In his books, Dr. Elder goes into significant detail discussing and explaining the rationale for
the tools he uses to analyze each timeframe. The reader is strongly referred to those books for additional information.
To gain a better understanding of Triple Screen, let's execute a trade with its methodology.
For this example, I will take the position of a swing trader. I will choose the 4 hour chart as my intermediate timeframe the daily for my long term and the 1 hour for my short term. I will use a
26 EMA for the daily chart to identify a trend, Dr Elder's own Force Index oscillator on the 4 Hour chart to locate a buy signal, and a trailing sell stop for entry on the 1 Hour chart.
We will trade the USDCHF. The current candle on Figure 1 below is on the 16th of September
of this year.
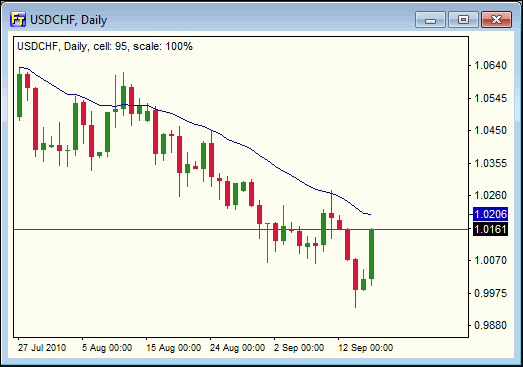
Figure 1
This is the First Screen and we are clearly in a downtrend. The 26 EMA is sloping down.
We have lower highs and lower lows. A simple eyeball examination by my 4 year old grandson would confirm this as well. Consequently, our choices are to consider the possibility of a short trade or to stand aside. A long trade is simply not an option, using this trading method.
We move on to the 4 Hour chart, Figure 2 below. This is the Second, or the Intermediate, Screen. It is midnight GMT on the 16th of September.
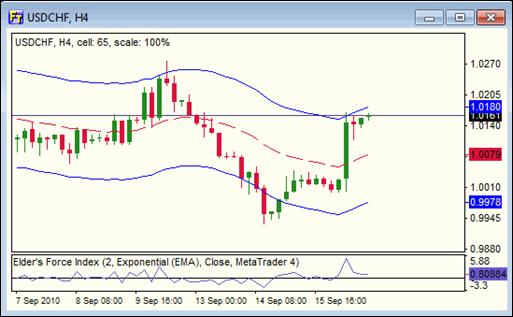
Figure 2
What we observe here is a correction or retracement in the downtrend that we observed on the Daily Chart. This wave is of course counter to the trend and might be the rally in the downtrend
that we are looking to sell. Our task is to try to determine just when to enter. We would like to
know when the retracement is complete and the downtrend will resume. This is the job of oscillators, and more specifically, just what Dr. Elder devised his Force Index to tell us. When
the Force Index declines below the zero line in an uptrend, we have a sell signal. So we must wait.
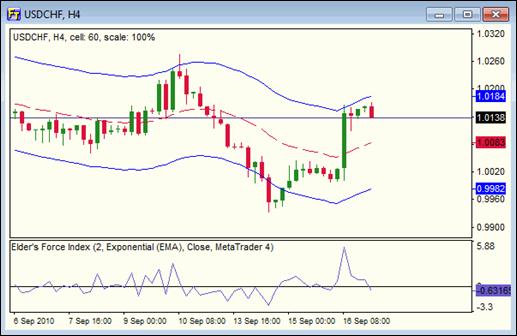
Figure 3
Four hours later, Figure 3 on our Intermediate timeframe, we have our signal to go short.
The Force Index has declined below zero. Now we move on to the Third Screen, the
1 Hour chart to find an entry.
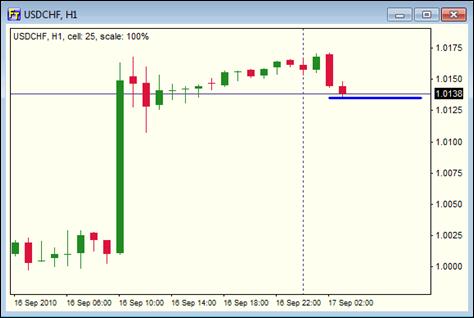
Figure 4
Figure 4 is the 1 Hour chart, our short term screen, when the Force Index went negative.
It is 0400 on September 17, 2010. The method of entry that we are going to use is a trailing
sell stop. It is a breakout entry that triggers when price breaks below the low of the prior candle, shown by the blue line on the chart above. If price does not break below in the next hour, this trigger level will move to the low of the next candle. Once the entry triggers, the stop will be
placed above the higher of the trigger candle or the entry candle.
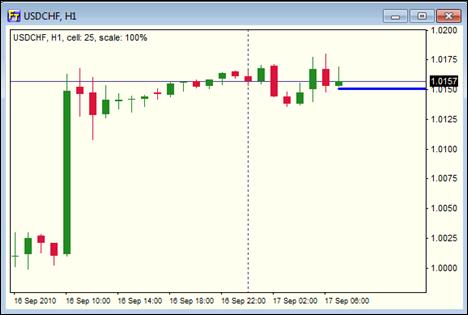
Figure 5
Figure 5 is the same chart at 0800. Four hours went by without an entry and now the trigger level is placed at the low of the current candle.
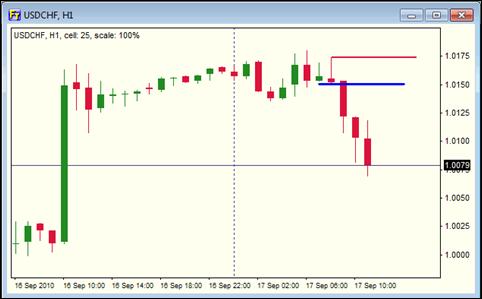
Figure 6
The trade triggers in the 0800 candle as shown on Figure 6 at a price of 1.0153 and we are in the market. We place the stop at the high of the 0800 candle as that is higher than the previous candle. And as can be seen, the trade takes off.
The take-profit level for this trade is determined on the same chart that I make my trade decision; Figure 3 above. I use a channel around the 26 EMA that contains about 95% of price and choose to exit when price reaches the lower channel. In this trade, that level was at 0.9960 for a profit of 193 pips, Figure 7.
That is how one would use the Triple Screen system in the Forex environment, following the methodology as described by Dr. Alexander Elder.
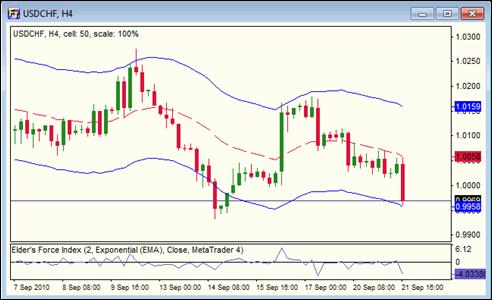
Figure 7
Just recently, Frank Paul released a new ForexMentor course titled Fibonacci Swing Trader Course & Advisory Service. While not specifically employing the same tools or criteria as the Triple Screen system, it is based on the Top Down approach to trend trading. As in the Triple Screen, this method can be applied to any time frame from Position Trading to Scalping. As a comparison to the trade that I presented above, let's see if we can execute the same trade using the Fibonacci Swing Trader Course.
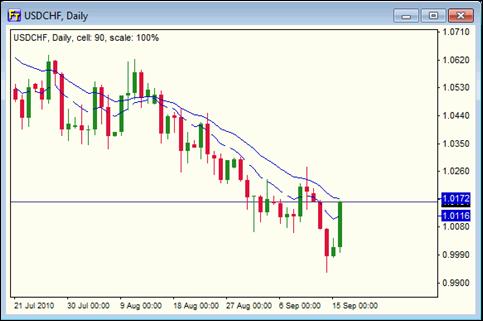
Figure 8
We are again swing trading and we will begin with the daily chart of the USDCHF, Figure 8. In this method, we analyze the chart for a trend using dual EMAs, the 10 EMA and a 20 EMA. We are interested in angle and separation as indication of the strength of the trend. We also are looking for the traditional pattern of lower highs and lows to confirm what the EMAs are telling us. In the chart above, all of these characteristics are present. Hence, we are clearly in a downtrend and we are interested in selling a rally. This gives us permission to now dig deeper and we move to a lower time-frame, namely the 4 Hour, Figure 9 below.
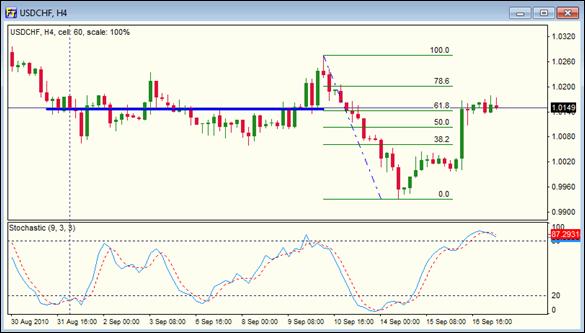
Figure 9
On the Figure 9 we observe a retracement against the trend that is finding resistance and consolidating near the price level of 1.0150. This is a rally in the daily downtrend, seen in greater detail on the 4 Hour chart and per the methodology explained in the course, we will attempt to sell this rally when we are of the opinion that the rally has completed. To come to that opinion, we apply knowledge of support and resistance and of price action. We are looking for a confluence
of characteristics to increase the probabilities in favor of a reversal to the downside.
The methodology requires us to qualify a swing high and a swing low, points A and B on Figure 9, then draw a Fibonacci retracement from those levels. We then look to find a confluence of support or resistance (Fib levels, Pivots, old highs and lows, etc.) which could increase the probability of price reversing. We reinforce that conclusion with an overbought or oversold indication from the 9,3,3 Stochastic indicator. Once we determine that the probabilities are favorable, we proceed to a lower timeframe, usually the 15 minute chart, to fine-tune an entry.
Indeed, in Figure 9, the Stochastic has turned over and price is consolidating at the .618 Fib level in confluence with a prior support/resistance level (see blue line). We will also see in Figure 10 below, the 15 minute chart, that there are an abundance of Pivots in the vicinity as well.
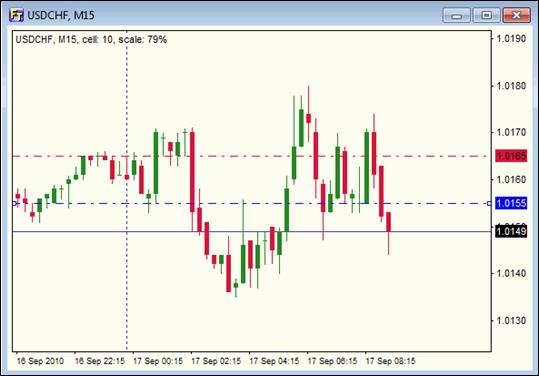
Figure 10
On the 15 minute chart we look for a way to enter the trade. There are many methods to enter; the trader is asked to use whatever method he/she is most comfortable with. For this exercise, I will use a method that calls for me to enter on the 15 minute candle after a confirmed swing high is in place, as it is in this chart. A swing high is defined as a high (X) preceded and followed by two lower highs. Thus, if the next candle opens at 1.0149, that will be our entry. We would normally place our stop above the swing high (A) but in this case, I would rather go above the previous swing high (Y), just over two hours back. So the stop will be at 1.0180 + 5 pips or 1.0185 for a 36 pip risk. The profits in this method are scaled out, half at the level "B" (Figure 9 above, and Figure 10 below) and half at a 1.270% extension of the Fibonacci swing (level "C" in Figure 10 below).
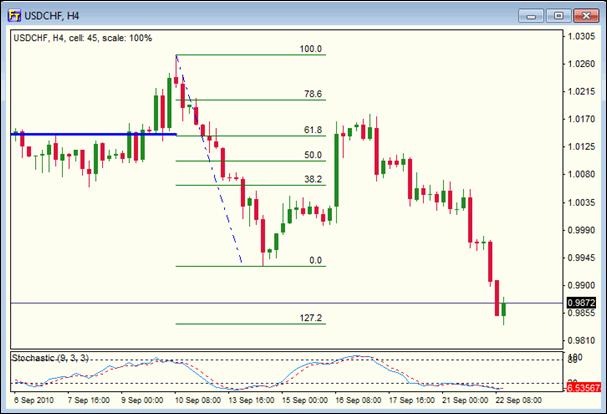
Figure 11
Top Down trading or analysis is not a trading methodology. If asked what trading system you used, you would no more answer Top Down analysis than you would answer Buy low, sell high, or Run profits, cut losses. These are nuggets of wisdom, not methods of trading. However, there are many methods or systems that rely on this wisdom and we have examined two of them in this article. In my mind, they are very similar, except for the details. Dr. Elder has fashioned his methods on the style that he developed and used for many years. He has been very successful. Frank Paul has shaped his methods around a style he uses and teaches as a member of the ForexMentor organization.
In this article I have tried to show the wisdom of Top Down analysis by giving you an example of a trade that was successful not necessarily because of the methods used to implement it, but by virtue of the top down analyses that underlie the method.
Index of All Forex Trading Articles
|
|