Forex Trading Articles
THE AB = CD PATTERN
By Dick Thompson for Forexmentor
©2010, Forexmentor.com, January, 2010
Most of us use Fibonacci ratios in our trading in one way or another and if you are like me, you find it a fascinating mathematical phenomenon. Just contemplating how prevalent the ratio Phi (1.618) is in all aspects of nature, and life in general, boggles the mind. And of course, the Fibonacci series is very much involved with Phi. But I digress.
In our use of Fibonacci, most of us simply take advantage of the Fib tools in our trading platforms and measure price retracements, using the Fibonacci ratios of .386, .50, .618 and .786 as support and resistance. Some of us use different levels and some of us combine these swings into patterns such as the Gartley, the Butterfly and perhaps even the Three Drives pattern.
But most of us don’t pay much attention to one pattern which can be traded on its own and is embedded in the Gartley and the Butterfly; the AB = CD.
What we now call the AB=CD was first presented by H. M. Gartley in his 1935 book Profits in the Stock Market. He described how the market would rally in an uptrend and then retrace. It would then rally to another uptrend then make another retracement forming an up sloping parallel channel.
Gartley spent several pages referring to these trend lines and parallel lines as excellent signals when used in conjunction with other working tools. He also applied these lines to price ratios. He used mainly ratios of one third and half retracements.
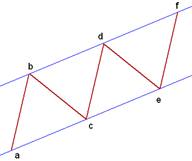
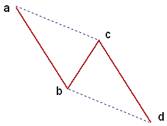
Gartley’s work was brought into modern times by Larry Pesavento in the late 90’s when he redefined the pattern specifically as a three-legged pattern and recommended parameters and criteria for their use. Shown below, is a Bullish AB=CD pattern.
This pattern can be found in all time frames and the “ideal” pattern will be symmetrical. Both the length of the CD leg in pips and the number of bars that it contains will be equal to the AB leg. The BC retracement of the AB swing will be either 61.8% or 78.6%. The CD retracement of the BC swing will be either 127.2% or 161.8%.
In my experience, the “ideal” pattern occurs much more frequently than one would expect, but normally, deviations can be expected. For instance, the CD leg will not equal the AB leg. When it is not equal, our preference should be that it be either 127.2% of AB or 161.8% of AB. The time (number of candles) of the CD leg, if not equal, should also be 127.2% or 161.8% of the AB leg.
In actual trading, we look for a BC retracement of the AB swing to be one of the normal Fibonacci ratios; .382, .50, .618, .786. Then, after a completion of the BC leg, we look for the CD leg to form and anticipate a completion such that its length in pips and hopefully also in time, is equal to AB or 1.272 or 1.618 of AB.
In addition, the pattern should retain its form, meaning that the BC leg should be shorter in length than the AB leg and the CD leg should be longer in length than the BC leg.
Finally, be alert for long candles and candles without tails moving against the direction of the trade. They may be warning signs.
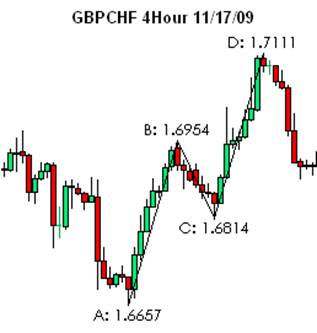
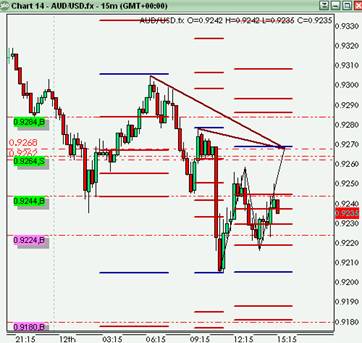
Lets look at some Forex currency trading examples:
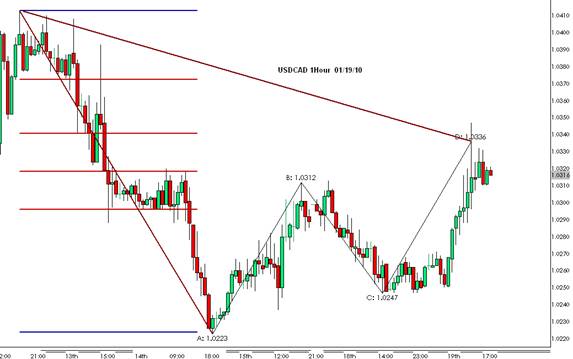
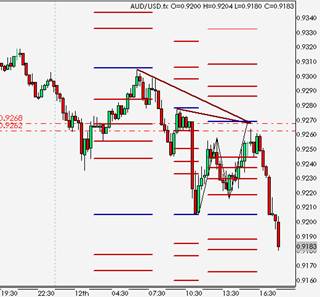
And finally, here is the setup of a trade that I took on January 12, 2010 and the result.
Index of All Forex Trading Articles
|
|