Forex Trading Articles
SPOTTING A DEVELOPING GARTLEY
By Dick Thompson for Forexmentor
©2009, Forexmentor.com, May, 2009
This article is prompted by a question I have been asked about
recognizing a Gartley pattern as it is developing, rather than after it is
complete (and perhaps too late to trade). I have outlined here a process that
one can use to do just that. Initially, I would suggest that the trader
actually draw the Fibs and the trendlines on a chart
as the pattern develops. After awhile, this can become a mental exercise until
the pattern is far enough along to become an actual trade setup. Of course, to
become a setup, make sure that the possible trade meets all of your other
criteria as well. In other words, a Gartley pattern all by itself may not be an
appropriate trade.
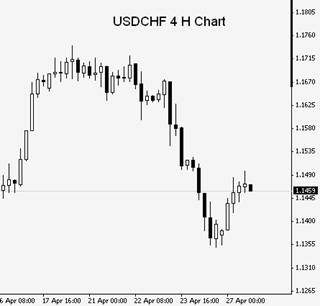
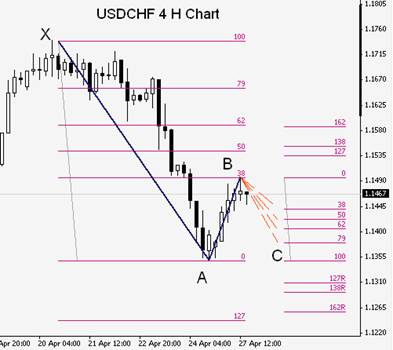
Lets look at a chart where price appears to have
completed a move in one direction and then retraced. For example, the USDCHF on
the 4 Hour chart on April 27, 2009. With
a doji at the end of this retracement and a black
candle forming (possible evening star), it is possible that this retracement
had come to and end.
On the assumption that this is a turning point, we can check with a Fib tool to determine how far it has retraced and we note that it is about 38% which is the minimum retracement that we could use in a Gartley pattern.
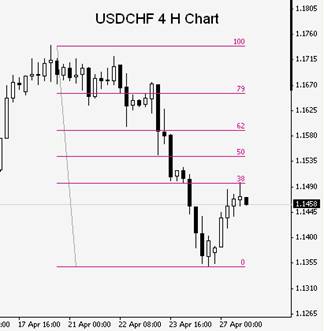
This 38% retracement could easily have been, or still might become, a 50% or 62% retracement; all typical Gartley retracements for a X - A swing.
We should recognize at this point that we are simply theorizing; we are not anticipating nor are we setting up a trade. We are simply going through a thought process that after a time, might become routine and help us recognize patterns as they are forming, rather than after the fact.
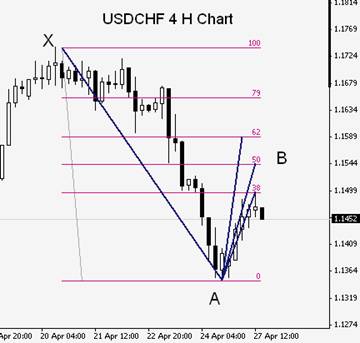
The next thing we might do is pull a Fib on the A - B swing to see if there is any confluence with the Fibs on the X - A swing. Let’s first remove the 50% and 62% retracements lines since at this point, we do have a possible 38% retracement.
It is pretty clear that the 162% extension of the A - B swing is in confluence with that 62% retracement of the X - A swing. This is good; we would expect this kind of confluence in a Gartley pattern.
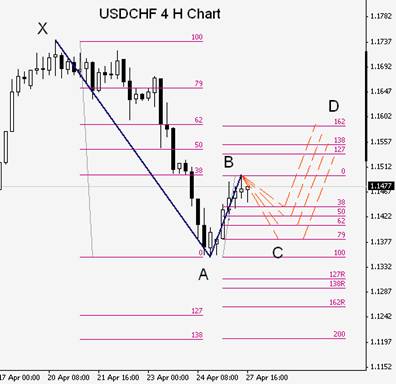
Let’s see what we might expect the B - C leg and then the C - D leg to look like. Remember, this is simply conjuncture. We have no strong reason to think that this pattern will in fact materialize; only that if it does, it would be a Gartley Pattern.
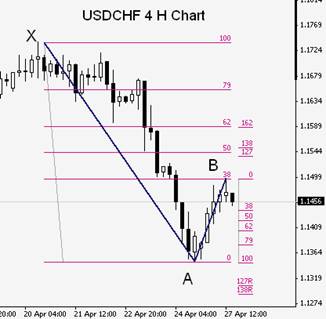
I have drawn four possible moves down to a level “C”, that are Fib retracements of the A - B swing. Of course, price will go wherever it wants. It does not have to, and most probably will not, move exactly to one of these levels.
However, if price indeed does move to one of these levels, or near enough to be able to say that it is conforming to a retracement level, we might expect it to then reverse and move back up to a point D. The question now becomes, how far? At this point, we might add a feature of an “ideal” Gartley to help us draw where that next point will be. That feature is that the C - D leg will be the same length as the A - B leg, or AB = CD.
What I have attempted to depict below are the possibilities of the subsequent price moves. Of course, price could move an infinite number of other places as well, but these are the moves that would result in an ideal Gartley pattern.
There are a few interesting possibilities here:
1. The B - C leg that retraces 38% followed by the C - D leg that moves to the A - B 162% extension and is in confluence with the 62% X - A retracement. This would be an ideal Gartley.
2. The B - C leg that retraces 62% followed by the C-D leg that moves to the A - B 138% extension and is in close confluence with the 50% X - A retracement.
3. The B - C leg that retraces 79% followed by the C - D leg that moves to the A - B 127% extension and is in close confluence with the 50% X - A retracement.
There are many other scenarios here as well: the point B could continue higher to a 50% X-A retracement, or the 62%. Those levels would open up a whole new set of possibilities.
Finally, let’s explore what actually happened as time went on.
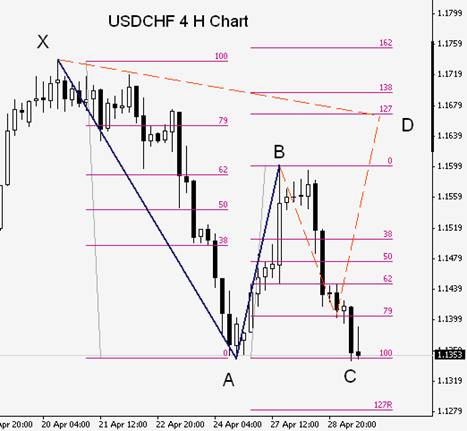
We first observe that the A – B leg did not stop at the 38% retracement of X – A, but continued up to just beyond the 62% retracement. This would still conform with a Gartley so we would still follow the development. From B, price fell and if it had retraced the A – B leg to a Fib level less than 100%, we would still have been able to call this a Gartley and perhaps would have seen a final leg, C – D, up to D. But price continued down actually below the point A, which negates the Gartley altogether.
To conclude, this process can be done on your charts on many swings until it becomes second nature to see the possibilities. From there, it can become a mental exercise which will allow you to recognize potential Gartley setups long before they materialize. Adding this skill to your toolbox hopefully will give you more possibilities for successful trades.
Good luck.
Index of All Forex Trading Articles

|
|