 |
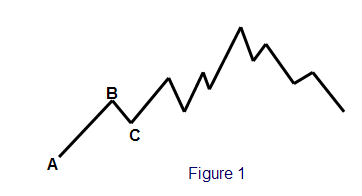
In addition, the number .50 is frequently included in practice as a Fibonacci number, although it is not mathematically derived from the Golden Mean. One can also find other numbers used by various practitioners, but we will restrict our discussion to those above and the value .50. In practice, as we all realize, markets do not move in straight lines. Markets in general are either moving up, down or sideways. When moving up or down, the movements are jagged, or saw-toothed, as shown in Figure 1 below.
Prices trend up, as in the movement from A to B, and then they move down against the trend, or retrace, from B to C. What is fascinating is how often the number of pips of this retracement corresponds to a Fibonacci Ratio.
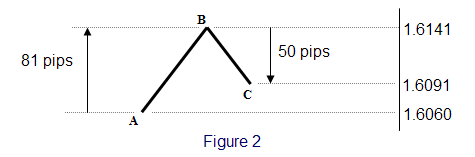
In Figure 2, the movement up from A to B of 81 pips is followed by a retracement down from B to C of 50 pips. The retracement from B to C is .618 of the movement up from A to B. In other words, this is a Fibonacci retracement of .618. (50/81 = .618)
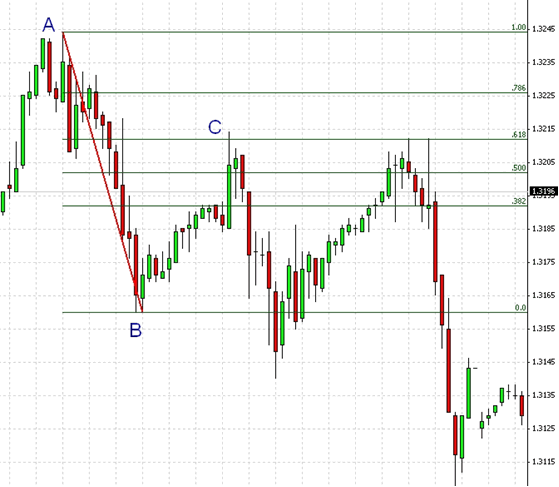
Figure 3 (above) is the EUR/USD hourly chart from Dec 20, 2006 . Here we see a move from a swing high at A down to a swing low at B, then a .618 retracement to another swing high at C. Note that this level becomes a Key resistance level and is respected by the next swing high as well.
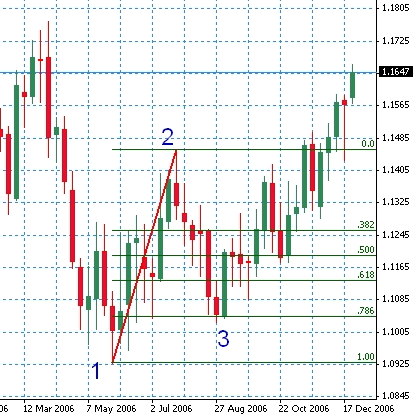
Figure 4 (above) is the USD/CAD weekly chart from the summer of 2006. Everybody should recognize this picture. This is the 1-2-3 bottom on the USD/CAD. Note how the 3 point is a perfect .786 retracement of the move from point 1 to point 2. From there it starts its bullish trend. Fibonacci levels are effective in any time frame. In the above example, the price matches the Fibonacci level almost perfectly, which is by no means unusual. However, in many cases, prices only come close. We live in an imperfect world, not an ideal world. Not all movements react at a Fibonacci level, just as other support and resistances (Pivots, previous highs and lows, etc.) are sometimes totally ignored by market flow. It is sufficient that these levels are well respected by the market with enough reliability to be tradable. In Part II, I will discuss the use of the charting tools to depict the Fibonacci ratios on our charts, introduce the concept of extensions, and we will begin to see how these patterns can be traded.
Index of Other Forex Trading Articles
"I feel totally empowered and humble all at the same time. If everyone learned from you guys, it might get a lot more difficult to make money in the Forex. Last week, using Chris's basic guidance I captured 300+ pips"
|
|