Forex Trading Articles
FIBONACCI FOR FOREX TRADING
(Part II)
By Dick Thompson for Forexmentor
©2009, Forexmentor.com, Feb, 2009
I introduced the Gartley pattern in Part IV of the January 2007 article “Using Fibonacci Ratios for Forex Trading”. In that article, I presented the following Figure:
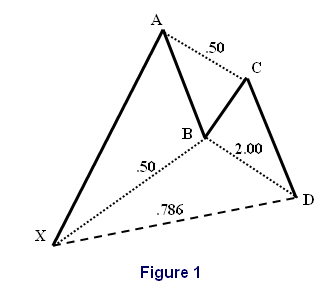
As I stated, the importance of this pattern in trading is that the probability of point D being a reversal point is supported by the fact that all swings are Fibonacci retracements or extensions.
As we well know, this is not a perfect world and we cannot expect the Gartley patterns that we encounter to be as perfect as Figure 1. The patterns almost always deviate, sometimes quite drastically. This then begs the questions, what are the tolerances on the Fib ratios on the various swings and also, when does a Gartley cease to be a tradable pattern?
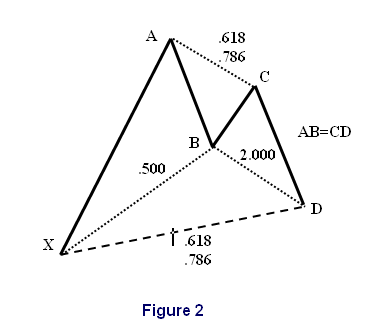
H. M. Gartley first introduced the idea of this pattern in his 1935 book “Profits in the Stock Market” and roughly described the ratios as one third and two thirds. Larry Pesavento was the first trader/writer to apply the Fibonacci ratios directly to the Gartley pattern in his 1997 book “Fibonacci Ratios with Pattern Recognition”. The following descriptions are based on his work and are presented with permission.
- The swing down from point A will terminate at point D. Point D will be at the .618 or .786 retracement approximately 75% of the time. The other 25%, the retracements will be .382, .500 or .707.
- There must be an AB=CD pattern observed in the move from A to D. (Please refer to my earlier article, Part III of “Using Fibonacci Ratios for Forex Trading” for a discussion of the AB=CD pattern)
- The BC move will be .618 or .786 of AB. In strongly trending markets expect a .382 or .500 retracement.
Applying these tolerances to Figure 1 above gives us the following Figure 2.
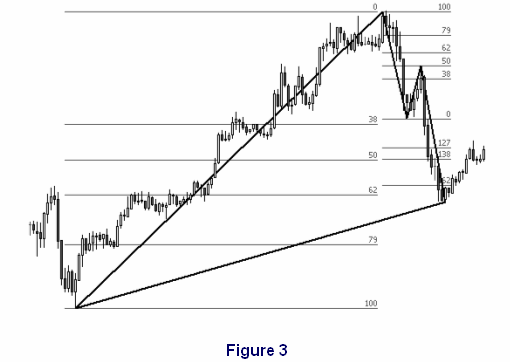
There are other, less important nuances in the Fibonacci retracements. The AB retracement can be from .382 to .618. The .382 retracement is sometimes referred to as a “shallow” Gartley, is usually followed by a Point D that doesn’t complete beyond the .618 level, and tends to occur in strong markets. The BC extension will also vary, usually from 1.270 up to 2.000. See Figure 3.
When does a Gartley pattern cease to be a Gartley? Here are three things that would cause the pattern to fail as a precursor of a probable outcome:
- Point D exceeds point X. In Figure 2 above, that would mean that D was lower than X. However, point D can double-bottom with X and still remain valid.
- The swing from B to C cannot go beyond A. In Figure 1 above, that would put C above A. However, the pattern can double-top, and still be valid. This is rare.
- The swing A to B cannot go beyond X. In Figure 1 above, that would put B below X.
Of course, the inverse of Figure 1 would reverse all of these rules accordingly.
The third article in this series will introduce one more pattern based on Fibonacci ratios, the Butterfly. The Butterfly has similarities to the Gartley and is primarily traded at tops and bottoms of trends.
part 1 - part 3
Index of All Forex Trading Articles

|